
Sugar Market Outlook: Global Supply Crunch Not So Sweet

Share This Story, Choose Your Platform!
Sugar Market Outlook
As we roll into March 2024, sugar stands as the beneficiary of two premier price indicators that are often regarded as the pinnacle of commodity analysis. These include a positive overarching fundamental perspective and a timely cyclical catalyst. Both suggesting a potential uplift in prices may be close.
Record Low Supplies Explained
When we discuss the “big picture” fundamentals in commodity markets, we usually focus on two or three key metrics that encapsulate the supply and demand for the year. These critical figures often include Global Ending Stocks and, more specifically, the Global Stocks to Usage ratios. Ending Stocks represent the remaining supply at the conclusion of the agricultural year, while the Stocks to Usage ratio compares these Ending Stocks against the anticipated demand for the forthcoming year.
Any piece of news you might encounter during your research on sugar—whether it concerns demand in China, production levels in India, or any supply and demand surpluses or deficits—ultimately contributes to these pivotal statistics. They are akin to ingredients added to a large pot, simmered to distill the essence of the market’s supply and demand balance.
In 2024, the scenario within the sugar industry is becoming increasingly critical, with Ending Stocks expected to plunge to their lowest since 2011 of 33.681 MMT and the Global stocks-to-usage ratio anticipated to be at its most contracted since 2010, recorded at 18.87%. Even when the USDA’s most recent report suggested global production would climb 4.7% year over year to a record 183.461 MMT. This tightening of supply relative to demand represents a significant shift, marking a period of heightened scarcity not seen for over a decade. The implications of such a constrained supply scenario are profound, emphasizing the limited buffer against any production shortfalls in 2024.
This situation is primarily driven by a combination of factors, including robust demand growth from markets such as India, the world’s number two sugar producer, which has radical goals of ethanol usage and export bans, alongside strong consumption rates in Brazil, the world’s leading sugar producer.
India Sugar Production
India, the world’s leading sugar consumer, prioritizes ensuring ample supplies and stabilizing prices. The nation usually holds over half of the global sugar reserves, making its decision to ban exports a potential threat to food security in regions heavily reliant on sugar imports. India has historically regulated its sugar exports to mitigate domestic food price inflation, setting limits before the onset of the new marketing year on October 1. For the 2022/23 season, which had a significant drop in sugar production, export quotas were restricted to 6.1 million tonnes, a reduction from 11 million tonnes.
Brazil to the Rescue AGAIN
The decline in India’s sugar production emphasizes the importance of Brazil’s sugarcane crop, the world’s leading producer. Brazil’s principal sugarcane regions have experienced the highest rainfall in two decades, leading to more than a 20% increase in sugarcane production in the Center-South region compared to last year.
This year, India’s sugar production is expected to fall short of domestic consumption for the first time in seven years due to insufficient rainfall. India recorded the driest August and 6% below average from June to August when it gets the most rainfall. This deficit and decreased yields in major sugar-producing states could compel India, the world’s second-largest sugar producer, to consider imports next year. The potential shortfall in India’s sugar production and the indefinite ban on sugar exports could increase global sugar prices, potentially benefiting Brazil, the top sugar exporter.
Although the Stocks-to-usage ratio of 18.87% for 2024 does not directly forecast short-term price movements, it undoubtedly lays the groundwork for understanding the broader market. This historically low ratio signals a tight supply situation and colors the market outlook with bullish sentiment, suggesting that, despite potential fluctuations, the overarching trend could lean towards higher prices in the face of dwindling reserves.
Sugar Seasonality
The secondary component critical to understanding the sugar trade is the presence of a seasonal catalyst. While overarching fundamentals lay the foundation for long-term market trends, identifying the timing of potential factors that could drive price changes is key for strategic decision-making.
Consider the following 15-year seasonal chart for sugar prices, which illustrates an average price trend over this period. It’s important to remember that such seasonal charts offer a historical perspective and do not guarantee future price movements. Historical performance is not a reliable indicator of future outcomes.
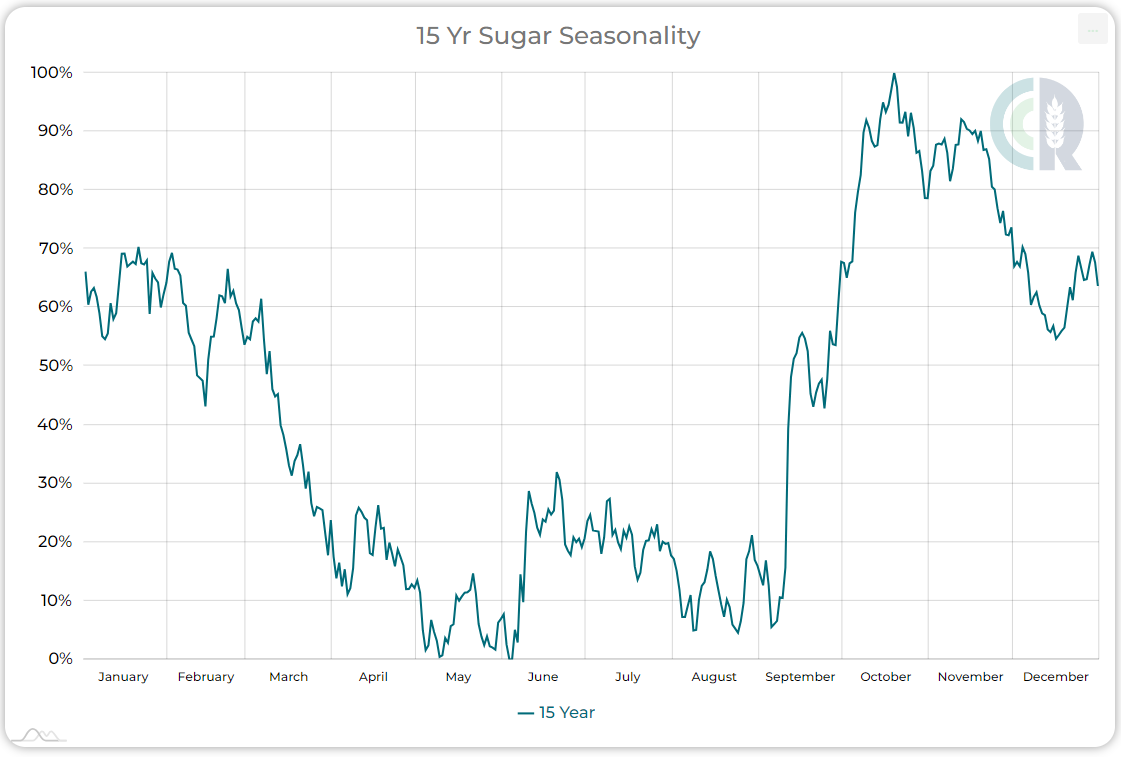
October Sugar Seasonal Chart: Historically, sugar prices have shown a tendency to hit their lowest points during the peak of the Brazilian harvest season, subsequently rising as the year progresses. However, it’s crucial to note that past performance does not guarantee future results.
Seasonal charts provide insights into recurring fundamental patterns that typically manifest around the same time each year. In the context of sugar, the price trend highlighted in the chart is closely tied to the onset of the sugar cane harvest in Brazil. Although Brazil is not the sole sugar producer globally, its significant contribution—accounting for about 25% of worldwide production and nearly half of the global sugar exports—makes the Brazilian harvest season a critical period for the sugar market. Most of this sugar comes from Brazil’s central-southern region, where the harvest season spans from April to November, with May and June marking the peak period of harvesting activity. This is when the supply of sugar reaches its highest, leading to the lowest prices of the year, as per the fundamental rule of commodity markets: high supply typically leads to lower prices. This pattern explains why sugar prices often find their lowest points in May, reflecting the increased market supply during the Brazilian harvest.
Following the phase where the 2024 sugar crop prices have stabilized, and the pace of the harvest begins to decrease, the market focus shifts toward the beet crops in the northern hemisphere. This transition period, marked by a reduction in Brazilian sugar influx and growing uncertainties around the beet harvest outcomes, has historically led to an uptick in prices, a trend well-documented by historical data.
The expectation for 2024 to follow this established pattern is strong, mainly due to the forecasted low-ending stocks. The market’s heightened sensitivity to fluctuations in the northern hemisphere’s crop yields could further exacerbate price movements.
Conclusion
As the Brazilian harvest progresses, we anticipate that sugar prices may reach their low in the coming weeks. Despite some reports suggesting a slight surplus in sugar for 2024, it’s crucial to recognize that yearly production surpluses or deficits do not directly correlate with overall price trends. Instead, the focus should be on the ending stocks-to-usage ratios, poised to hit historically low levels this year. This scenario suggests a minimal risk for significant price declines in sugar during the latter half of 2024.
As the Brazilian harvest continues, the market’s gaze will inevitably pivot to the northern hemisphere’s beet crop, harvested in the autumn. This shift in focus could serve as a pivotal factor for an upward price trajectory, reinforcing the significance of understanding both the timing and the underlying reasons behind seasonal price variations.
If you liked this article, check out our other outlooks here!
About the Author: Justin Cardwell
Questions, comments, or suggestions? We’d like to hear from you. Send your feedback directly to
![]()
Share This Story, Choose Your Platform!
Related Posts


Sugar Market Outlook: Global Supply Crunch Not So Sweet
Share This Story, Choose Your Platform
Sugar Market Outlook
As we roll into March 2024, sugar stands as the beneficiary of two premier price indicators that are often regarded as the pinnacle of commodity analysis. These include a positive overarching fundamental perspective and a timely cyclical catalyst. Both suggesting a potential uplift in prices may be close.
Record Low Supplies Explained
When we discuss the “big picture” fundamentals in commodity markets, we usually focus on two or three key metrics that encapsulate the supply and demand for the year. These critical figures often include Global Ending Stocks and, more specifically, the Global Stocks to Usage ratios. Ending Stocks represent the remaining supply at the conclusion of the agricultural year, while the Stocks to Usage ratio compares these Ending Stocks against the anticipated demand for the forthcoming year.
Any piece of news you might encounter during your research on sugar—whether it concerns demand in China, production levels in India, or any supply and demand surpluses or deficits—ultimately contributes to these pivotal statistics. They are akin to ingredients added to a large pot, simmered to distill the essence of the market’s supply and demand balance.
In 2024, the scenario within the sugar industry is becoming increasingly critical, with Ending Stocks expected to plunge to their lowest since 2011 of 33.681 MMT and the Global stocks-to-usage ratio anticipated to be at its most contracted since 2010, recorded at 18.87%. Even when the USDA’s most recent report suggested global production would climb 4.7% year over year to a record 183.461 MMT. This tightening of supply relative to demand represents a significant shift, marking a period of heightened scarcity not seen for over a decade. The implications of such a constrained supply scenario are profound, emphasizing the limited buffer against any production shortfalls in 2024.
This situation is primarily driven by a combination of factors, including robust demand growth from markets such as India, the world’s number two sugar producer, which has radical goals of ethanol usage and export bans, alongside strong consumption rates in Brazil, the world’s leading sugar producer.
India Sugar Production
India, the world’s leading sugar consumer, prioritizes ensuring ample supplies and stabilizing prices. The nation usually holds over half of the global sugar reserves, making its decision to ban exports a potential threat to food security in regions heavily reliant on sugar imports. India has historically regulated its sugar exports to mitigate domestic food price inflation, setting limits before the onset of the new marketing year on October 1. For the 2022/23 season, which had a significant drop in sugar production, export quotas were restricted to 6.1 million tonnes, a reduction from 11 million tonnes.
Brazil to the Rescue AGAIN
The decline in India’s sugar production emphasizes the importance of Brazil’s sugarcane crop, the world’s leading producer. Brazil’s principal sugarcane regions have experienced the highest rainfall in two decades, leading to more than a 20% increase in sugarcane production in the Center-South region compared to last year.
This year, India’s sugar production is expected to fall short of domestic consumption for the first time in seven years due to insufficient rainfall. India recorded the driest August and 6% below average from June to August when it gets the most rainfall. This deficit and decreased yields in major sugar-producing states could compel India, the world’s second-largest sugar producer, to consider imports next year. The potential shortfall in India’s sugar production and the indefinite ban on sugar exports could increase global sugar prices, potentially benefiting Brazil, the top sugar exporter.
Although the Stocks-to-usage ratio of 18.87% for 2024 does not directly forecast short-term price movements, it undoubtedly lays the groundwork for understanding the broader market. This historically low ratio signals a tight supply situation and colors the market outlook with bullish sentiment, suggesting that, despite potential fluctuations, the overarching trend could lean towards higher prices in the face of dwindling reserves.
Sugar Seasonality
The secondary component critical to understanding the sugar trade is the presence of a seasonal catalyst. While overarching fundamentals lay the foundation for long-term market trends, identifying the timing of potential factors that could drive price changes is key for strategic decision-making.
Consider the following 15-year seasonal chart for sugar prices, which illustrates an average price trend over this period. It’s important to remember that such seasonal charts offer a historical perspective and do not guarantee future price movements. Historical performance is not a reliable indicator of future outcomes.
October Sugar Seasonal Chart: Historically, sugar prices have shown a tendency to hit their lowest points during the peak of the Brazilian harvest season, subsequently rising as the year progresses. However, it’s crucial to note that past performance does not guarantee future results.
Seasonal charts provide insights into recurring fundamental patterns that typically manifest around the same time each year. In the context of sugar, the price trend highlighted in the chart is closely tied to the onset of the sugar cane harvest in Brazil. Although Brazil is not the sole sugar producer globally, its significant contribution—accounting for about 25% of worldwide production and nearly half of the global sugar exports—makes the Brazilian harvest season a critical period for the sugar market. Most of this sugar comes from Brazil’s central-southern region, where the harvest season spans from April to November, with May and June marking the peak period of harvesting activity. This is when the supply of sugar reaches its highest, leading to the lowest prices of the year, as per the fundamental rule of commodity markets: high supply typically leads to lower prices. This pattern explains why sugar prices often find their lowest points in May, reflecting the increased market supply during the Brazilian harvest.
Following the phase where the 2024 sugar crop prices have stabilized, and the pace of the harvest begins to decrease, the market focus shifts toward the beet crops in the northern hemisphere. This transition period, marked by a reduction in Brazilian sugar influx and growing uncertainties around the beet harvest outcomes, has historically led to an uptick in prices, a trend well-documented by historical data.
The expectation for 2024 to follow this established pattern is strong, mainly due to the forecasted low-ending stocks. The market’s heightened sensitivity to fluctuations in the northern hemisphere’s crop yields could further exacerbate price movements.
Conclusion
As the Brazilian harvest progresses, we anticipate that sugar prices may reach their low in the coming weeks. Despite some reports suggesting a slight surplus in sugar for 2024, it’s crucial to recognize that yearly production surpluses or deficits do not directly correlate with overall price trends. Instead, the focus should be on the ending stocks-to-usage ratios, poised to hit historically low levels this year. This scenario suggests a minimal risk for significant price declines in sugar during the latter half of 2024.
As the Brazilian harvest continues, the market’s gaze will inevitably pivot to the northern hemisphere’s beet crop, harvested in the autumn. This shift in focus could serve as a pivotal factor for an upward price trajectory, reinforcing the significance of understanding both the timing and the underlying reasons behind seasonal price variations.
If you liked this article, check out our other outlooks here!
About the Author: Justin Cardwell
Questions, comments, or suggestions? We’d like to hear from you. Send your feedback directly to
![]()
Share This Story, Choose Your Platform!
Sugar Market Outlook: Global Supply Crunch Not So Sweet
Share This Story, Choose Your Platform
Sugar Market Outlook
As we roll into March 2024, sugar stands as the beneficiary of two premier price indicators that are often regarded as the pinnacle of commodity analysis. These include a positive overarching fundamental perspective and a timely cyclical catalyst. Both suggesting a potential uplift in prices may be close.
Record Low Supplies Explained
When we discuss the “big picture” fundamentals in commodity markets, we usually focus on two or three key metrics that encapsulate the supply and demand for the year. These critical figures often include Global Ending Stocks and, more specifically, the Global Stocks to Usage ratios. Ending Stocks represent the remaining supply at the conclusion of the agricultural year, while the Stocks to Usage ratio compares these Ending Stocks against the anticipated demand for the forthcoming year.
Any piece of news you might encounter during your research on sugar—whether it concerns demand in China, production levels in India, or any supply and demand surpluses or deficits—ultimately contributes to these pivotal statistics. They are akin to ingredients added to a large pot, simmered to distill the essence of the market’s supply and demand balance.
In 2024, the scenario within the sugar industry is becoming increasingly critical, with Ending Stocks expected to plunge to their lowest since 2011 of 33.681 MMT and the Global stocks-to-usage ratio anticipated to be at its most contracted since 2010, recorded at 18.87%. Even when the USDA’s most recent report suggested global production would climb 4.7% year over year to a record 183.461 MMT. This tightening of supply relative to demand represents a significant shift, marking a period of heightened scarcity not seen for over a decade. The implications of such a constrained supply scenario are profound, emphasizing the limited buffer against any production shortfalls in 2024.
This situation is primarily driven by a combination of factors, including robust demand growth from markets such as India, the world’s number two sugar producer, which has radical goals of ethanol usage and export bans, alongside strong consumption rates in Brazil, the world’s leading sugar producer.
India Sugar Production
India, the world’s leading sugar consumer, prioritizes ensuring ample supplies and stabilizing prices. The nation usually holds over half of the global sugar reserves, making its decision to ban exports a potential threat to food security in regions heavily reliant on sugar imports. India has historically regulated its sugar exports to mitigate domestic food price inflation, setting limits before the onset of the new marketing year on October 1. For the 2022/23 season, which had a significant drop in sugar production, export quotas were restricted to 6.1 million tonnes, a reduction from 11 million tonnes.
Brazil to the Rescue AGAIN
The decline in India’s sugar production emphasizes the importance of Brazil’s sugarcane crop, the world’s leading producer. Brazil’s principal sugarcane regions have experienced the highest rainfall in two decades, leading to more than a 20% increase in sugarcane production in the Center-South region compared to last year.
This year, India’s sugar production is expected to fall short of domestic consumption for the first time in seven years due to insufficient rainfall. India recorded the driest August and 6% below average from June to August when it gets the most rainfall. This deficit and decreased yields in major sugar-producing states could compel India, the world’s second-largest sugar producer, to consider imports next year. The potential shortfall in India’s sugar production and the indefinite ban on sugar exports could increase global sugar prices, potentially benefiting Brazil, the top sugar exporter.
Although the Stocks-to-usage ratio of 18.87% for 2024 does not directly forecast short-term price movements, it undoubtedly lays the groundwork for understanding the broader market. This historically low ratio signals a tight supply situation and colors the market outlook with bullish sentiment, suggesting that, despite potential fluctuations, the overarching trend could lean towards higher prices in the face of dwindling reserves.
Sugar Seasonality
The secondary component critical to understanding the sugar trade is the presence of a seasonal catalyst. While overarching fundamentals lay the foundation for long-term market trends, identifying the timing of potential factors that could drive price changes is key for strategic decision-making.
Consider the following 15-year seasonal chart for sugar prices, which illustrates an average price trend over this period. It’s important to remember that such seasonal charts offer a historical perspective and do not guarantee future price movements. Historical performance is not a reliable indicator of future outcomes.
October Sugar Seasonal Chart: Historically, sugar prices have shown a tendency to hit their lowest points during the peak of the Brazilian harvest season, subsequently rising as the year progresses. However, it’s crucial to note that past performance does not guarantee future results.
Seasonal charts provide insights into recurring fundamental patterns that typically manifest around the same time each year. In the context of sugar, the price trend highlighted in the chart is closely tied to the onset of the sugar cane harvest in Brazil. Although Brazil is not the sole sugar producer globally, its significant contribution—accounting for about 25% of worldwide production and nearly half of the global sugar exports—makes the Brazilian harvest season a critical period for the sugar market. Most of this sugar comes from Brazil’s central-southern region, where the harvest season spans from April to November, with May and June marking the peak period of harvesting activity. This is when the supply of sugar reaches its highest, leading to the lowest prices of the year, as per the fundamental rule of commodity markets: high supply typically leads to lower prices. This pattern explains why sugar prices often find their lowest points in May, reflecting the increased market supply during the Brazilian harvest.
Following the phase where the 2024 sugar crop prices have stabilized, and the pace of the harvest begins to decrease, the market focus shifts toward the beet crops in the northern hemisphere. This transition period, marked by a reduction in Brazilian sugar influx and growing uncertainties around the beet harvest outcomes, has historically led to an uptick in prices, a trend well-documented by historical data.
The expectation for 2024 to follow this established pattern is strong, mainly due to the forecasted low-ending stocks. The market’s heightened sensitivity to fluctuations in the northern hemisphere’s crop yields could further exacerbate price movements.
Conclusion
As the Brazilian harvest progresses, we anticipate that sugar prices may reach their low in the coming weeks. Despite some reports suggesting a slight surplus in sugar for 2024, it’s crucial to recognize that yearly production surpluses or deficits do not directly correlate with overall price trends. Instead, the focus should be on the ending stocks-to-usage ratios, poised to hit historically low levels this year. This scenario suggests a minimal risk for significant price declines in sugar during the latter half of 2024.
As the Brazilian harvest continues, the market’s gaze will inevitably pivot to the northern hemisphere’s beet crop, harvested in the autumn. This shift in focus could serve as a pivotal factor for an upward price trajectory, reinforcing the significance of understanding both the timing and the underlying reasons behind seasonal price variations.
If you liked this article, check out our other outlooks here!
Questions, comments, or suggestions? We’d like to hear from you. Send your feedback directly to
![]()